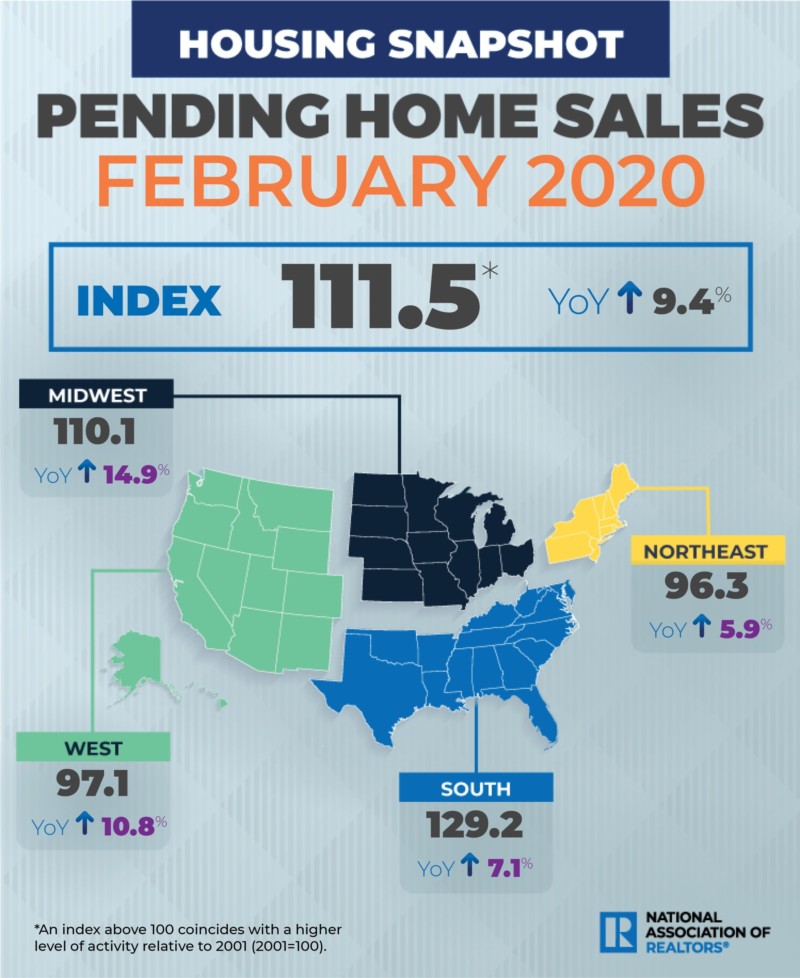
Pending home sales rose in February, climbing for the second consecutive month, according to the National Association of Realtors®. Each of the four major regions saw an increase in month-over-month contract activity, as well as growth in year-over-year pending home sales transactions compared to one year ago.
The Pending Home Sales Index (PHSI),* www.nar.realtor/pending-home-sales, a forward-looking indicator based on contract signings, grew 2.4% to 111.5 in February. Year-over-year contract signings increased 9.4%. An index of 100 is equal to the level of contract activity in 2001.
“February’s pending sales figures show the housing market had been very healthy prior to the coronavirus-induced shutdown,” said Lawrence Yun, NAR’s chief economist. He noted that the data does not capture the significant fallout from the pandemic or the measures taken to control the outbreak. “Numbers in the coming weeks will show just how hard the housing market was hit, but I am optimistic that the upcoming stimulus package will lessen the economic damage and we may get a V-shaped robust recovery later in the year.”
Yun says that naturally there will be a lengthier stay of inventory in the market from reduced short-term demand, citing data from active listings at realtor.com® that show year-over-year increases. Markets drawing some of the most significant buyer attention include Colorado Springs, Colo.; Lafayette, Ind.; Modesto, Calif.; Rochester, N.Y.; and Sacramento, Calif.
“Housing, just like most other industries, suffered from the coronavirus crisis, but once this predicament is behind us and the habit of social distancing is respected, I’m encouraged there will be continued home transactions though with more virtual tours, electronic signatures, and external home appraisals,” Yun said. “Many of the home sales that are likely to be missed during the first part of 2020 may simply be pushed into late summer and autumn parts of the year.”
February Pending Home Sales Regional Breakdown
The Northeast PHSI rose 2.8% to 96.3 in February, 5.9% higher than a year ago. In the Midwest, the index increased 4.5% to 110.1 last month, 14.9% higher than in February 2019.
Pending home sales in the South inched up 0.1% to an index of 129.2 in February, a 7.1% increase from February 2019. The index in the West grew 4.6% in February 2020 to 97.1, a jump of 10.8% from a year ago.
The National Association of Realtors® is America’s largest trade association, representing more than 1.4 million members involved in all aspects of the residential and commercial real estate industries.
*The Pending Home Sales Index is a leading indicator for the housing sector, based on pending sales of existing homes. A sale is listed as pending when the contract has been signed but the transaction has not closed, though the sale usually is finalized within one or two months of signing.
The index is based on a large national sample, typically representing about 20% of transactions for existing-home sales. In developing the model for the index, it was demonstrated that the level of monthly sales-contract activity parallels the level of closed existing-home sales in the following two months.
An index of 100 is equal to the average level of contract activity during 2001, which was the first year to be examined. By coincidence, the volume of existing-home sales in 2001 fell within the range of 5.0 to 5.5 million, which is considered normal for the current U.S. population.
NOTE: Existing-Home Sales for March will be reported April 21. The next Pending Home Sales Index will be April 29; all release times are 10:00 a.m. ET.


