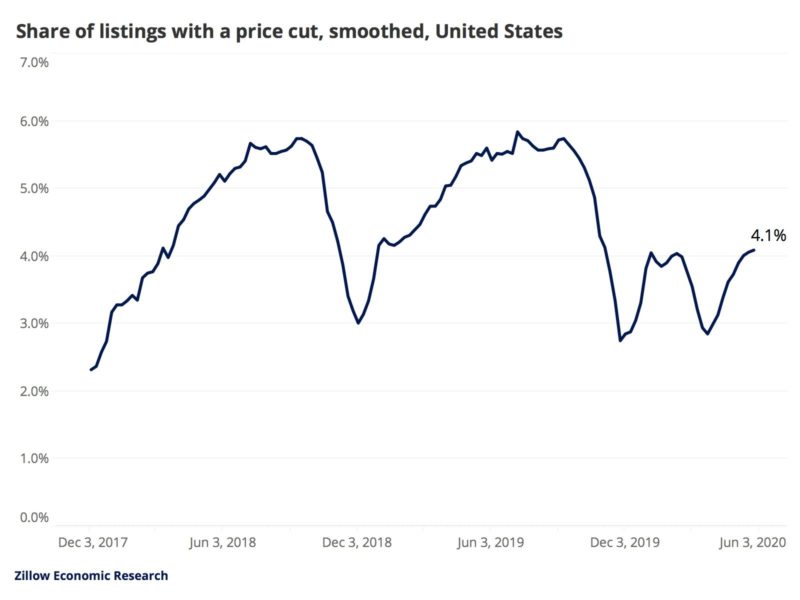
A lower-than-normal share of listings with a price cut is another signal the market has tilted in favor of sellers
– Only 4.1% of current listings have had a price cut, compared to 5.6% at the same time last year.
– The largest 35 metropolitan areas have all seen fewer listings with price cuts now compared to a year ago — with New York, Miami and Riverside metros seeing the lowest share.
– High buyer demand coupled with record-low inventory — down 21% from last year — is keeping home prices steady.
In yet another sign that home sellers have the advantage in the current housing market, a new Zillow® analysis shows the share of listings with a price cut is down compared to last year. Only 4.1% of homes on the market as of June 27 had a price cut, compared to 5.6% at this time last year.
Typically the share of listings with a price cut increases as the home selling season continues, rising steadily from February to October. This year, however, price cuts flatlined from February to March, with around 4% of listings offering a price cut — atypical behavior compared to previous years — and then dropped to annual lows in April at 2.9%. Since then, more homes saw price cuts, though the share remains well below what would be expected in a normal year.
A Zillow survey in April1 showed the majority of sellers (59%) assumed the coronavirus pandemic would result in a buyers market. But high buyer demand coupled with extremely tight inventory (down 21% YoY) has resulted in homes flying off the market at record pace and fewer price cuts.
“This may be our strongest signal yet that sellers have the upper hand in the housing market today — and they know it,” said Jeff Tucker, economist at Zillow. “Many buyers still think they can make lowball offers and score a great deal in the midst of today’s economic turbulence, but sellers are holding firm on list prices. For-sale inventory has been setting new record lows this spring, so sellers know that buyers are starved for options. Despite the lack of price cuts, sellers are still able to sell their homes faster than they did this time last year.”
Out of the 50 largest U.S. metropolitan areas, New York (2.8%), Miami (3.3%) and Riverside (3.8%) have the lowest share of listings with a price cut — with New York’s level lower than what’s normally seen in December. However, those shopping in Denver (9.1%), Indianapolis (7.4%), and Chicago (6.9%) will see the largest share of price cuts.
The typical home value in the U.S. is $251,598 up 4.3% compared to a year ago. Zillow’s most recent home price forecast expects a slight 1.8% drop in prices from April to October 2020, with recovery through 2021.
|
Metropolitan Area* |
Share of |
Share of |
|
United States |
4.1% |
5.6% |
|
New York, NY |
2.8% |
5.3% |
|
Los Angeles-Long Beach-Anaheim, CA |
4.5% |
6.5% |
|
Chicago, IL |
6.9% |
9.2% |
|
Dallas-Fort Worth, TX |
6.2% |
8.5% |
|
Philadelphia, PA |
5.3% |
7.2% |
|
Houston, TX |
5.8% |
7.7% |
|
Washington, DC |
4.8% |
7.0% |
|
Miami-Fort Lauderdale, FL |
3.3% |
4.4% |
|
Atlanta, GA |
5.1% |
7.5% |
|
Boston, MA |
5.1% |
7.1% |
|
San Francisco, CA |
4.7% |
5.8% |
|
Detroit, MI |
6.3% |
8.3% |
|
Riverside, CA |
3.8% |
6.2% |
|
Phoenix, AZ |
4.9% |
7.8% |
|
Seattle, WA |
5.6% |
8.1% |
|
Minneapolis-St Paul, MN |
5.0% |
6.7% |
|
San Diego, CA |
5.2% |
8.1% |
|
St. Louis, MO |
5.5% |
6.8% |
|
Tampa, FL |
6.5% |
8.0% |
|
Baltimore, MD |
6.0% |
8.1% |
|
Denver, CO |
9.1% |
10.9% |
|
Pittsburgh, PA |
6.2% |
6.5% |
|
Portland, OR |
5.3% |
8.6% |
|
Charlotte, NC |
5.9% |
8.0% |
|
Sacramento, CA |
6.4% |
8.1% |
|
San Antonio, TX |
5.2% |
7.2% |
|
Orlando, FL |
5.9% |
7.4% |
|
Cincinnati, OH |
6.8% |
8.4% |
|
Cleveland, OH |
4.7% |
5.3% |
|
Kansas City, MO |
5.8% |
7.4% |
|
Las Vegas, NV |
5.8% |
9.0% |
|
Columbus, OH |
6.6% |
9.3% |
|
Indianapolis, IN |
7.4% |
9.1% |
|
San Jose, CA |
5.5% |
7.8% |
|
Austin, TX |
6.2% |
8.6% |
|
*Table organized by market size |
||
|
**Data from the week ending in June 27, 2020 |
||
|
***Data from the week ending in June 29, 2019 |
||


